The tool
The method, as a working tool
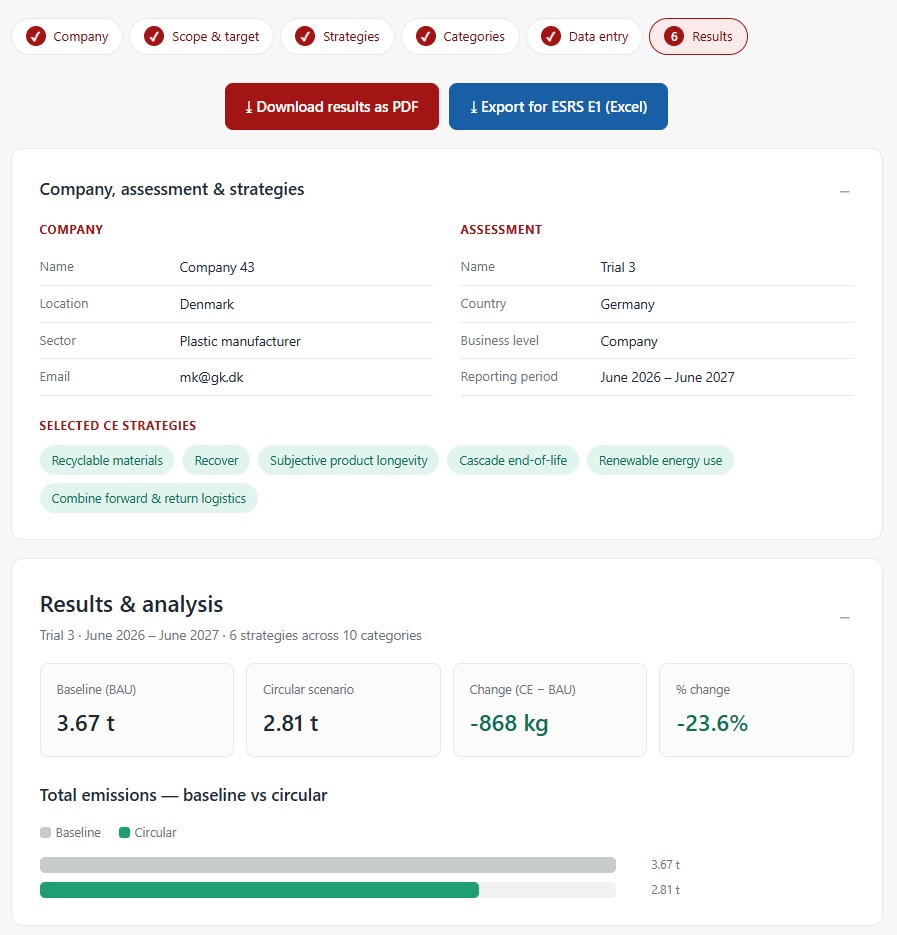
The clean re-implementation is running. It takes a company's own activity data, compares a business-as-usual baseline against a circular scenario across the Scope 3 categories, and now puts the cost of each strategy right next to its carbon result. The screens below are from the live tool, shown with sample data.
Measure the delta
 Add
Add figures/tool-results.jpgthe results overview screen
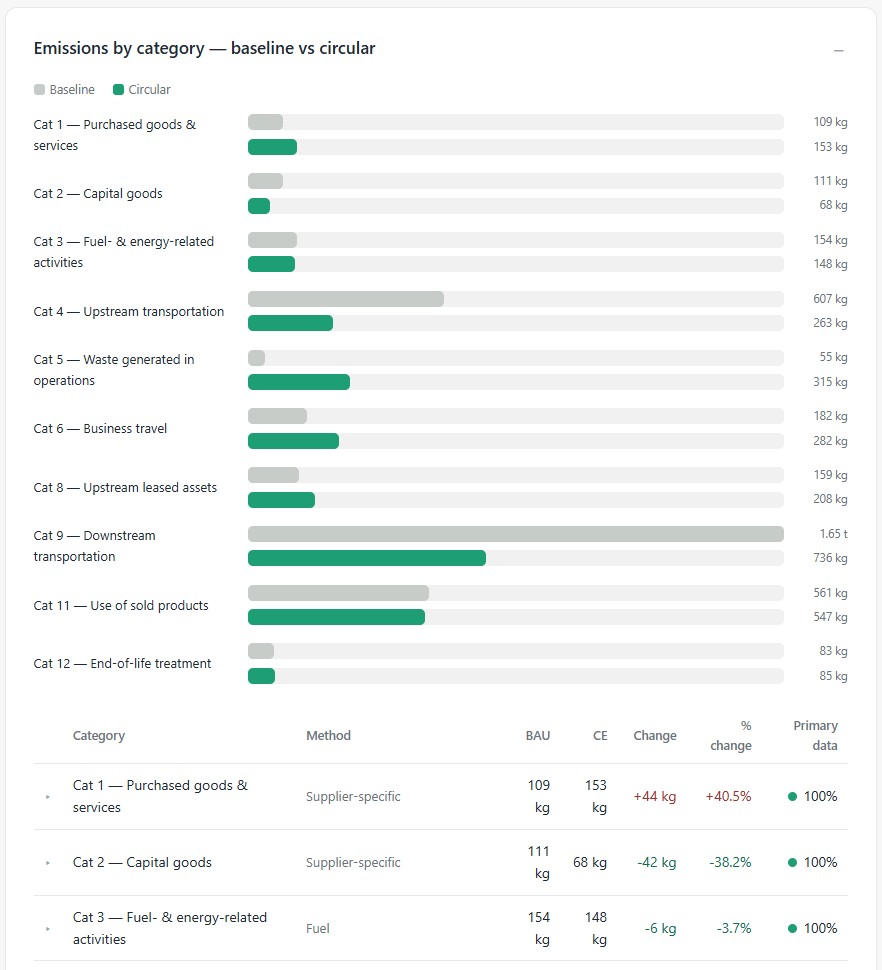
See how every category perform
 Add
Add figures/tool-categories.jpgthe per-category breakdown screen
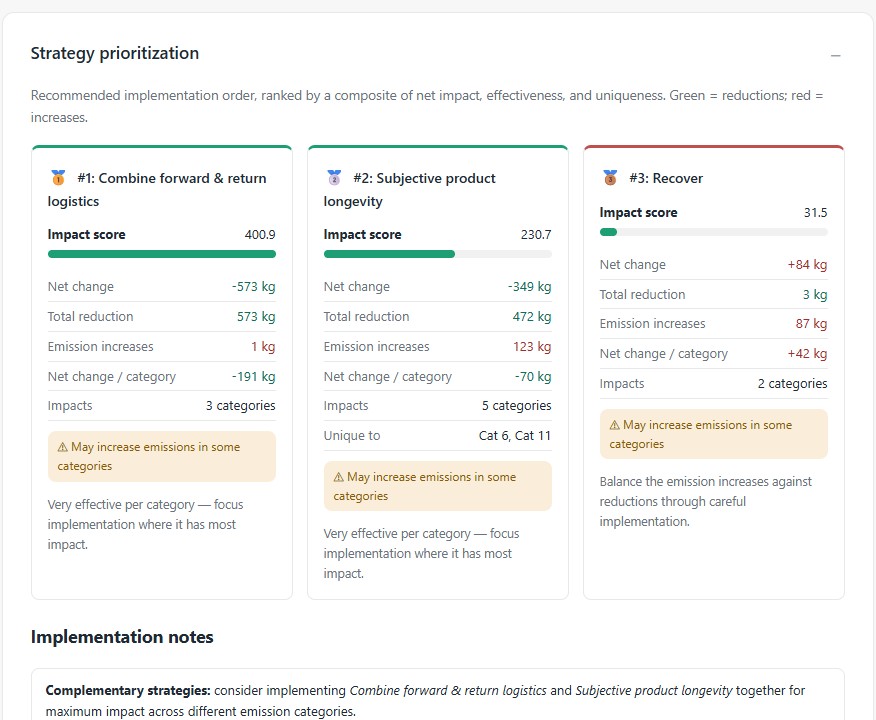
Rank the circular strategies
 Add
Add figures/tool-prioritisation.jpgthe strategy-prioritisation screen
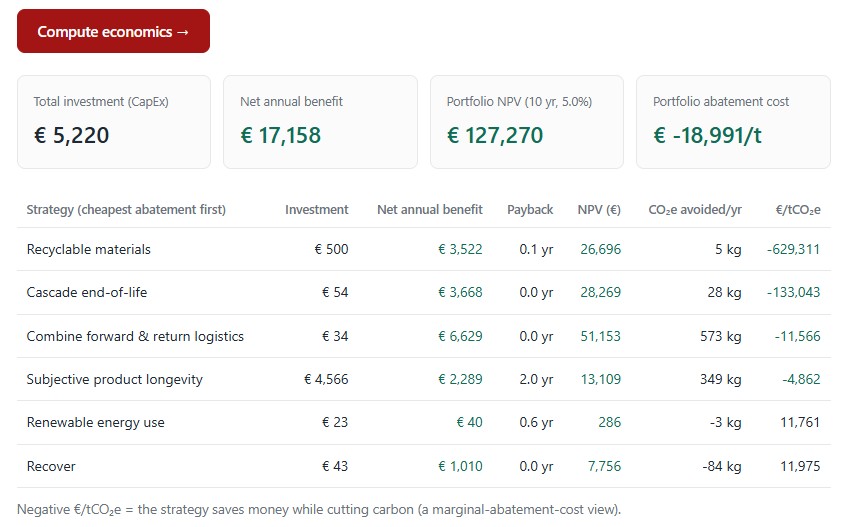
Does it pay back?
 Add
Add figures/tool-economics.jpgthe economics screen (new)
See it run!
I am walking manufacturers and practitioners through the tool to solve real questions — recycled content versus low-carbon sourcing, which strategies pay back, what a disclosure-ready export looks like. If that would be useful, book a short demo.