Naming the gap
How little of a company's circular-economy strategy is actually accounted for in its science-based carbon targets.
Read paperThe method
CS3 is the first operational, GHG-Protocol-aligned method for calculating the Scope 3 emissions of 30+ circular-economy strategies. It quantifies how each strategy raises or lowers reported emissions, separates the burden a strategy adds from the impact it avoids, and reports the result in alignment with SBTi and CSRD disclosure.
 Add
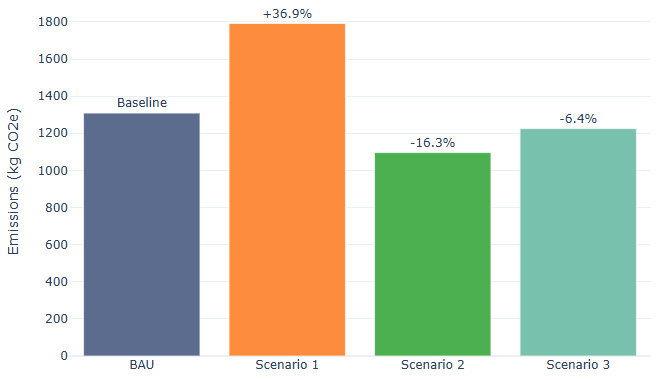
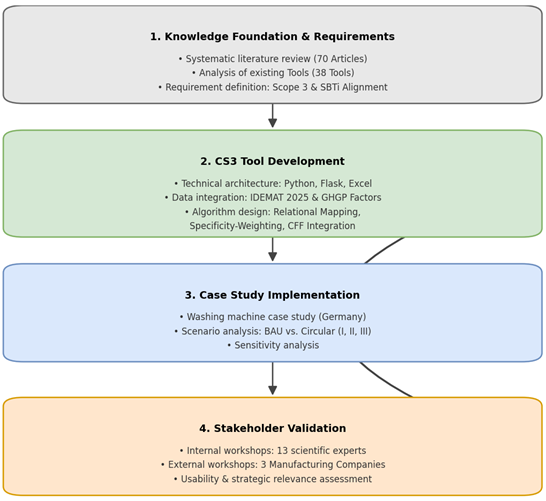
Add figures/fig5-scenarios.pngThe method was developed at DTU from a systematic review of 70 studies and an assessment of 38 existing tools, then tested on a washing-machine case study and refined through workshops with thirteen scientific experts and engineers, and three manufacturing companies. It's peer-reviewed and published open-access.
 Add
Add figures/fig2-framework.png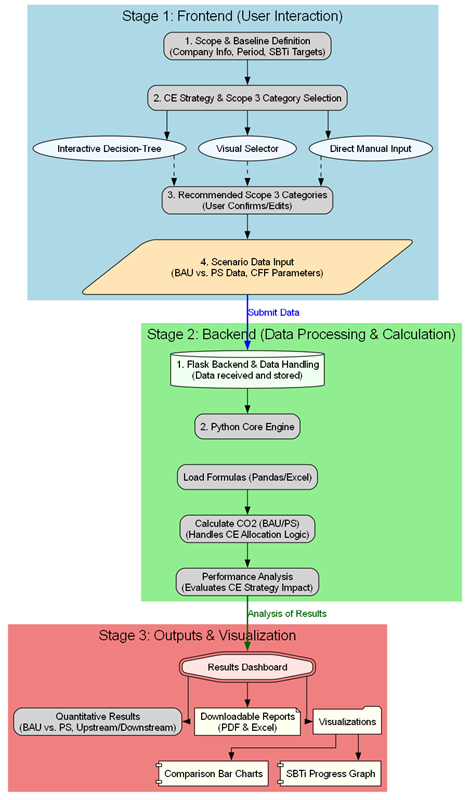 Add
Add figures/fig4-workflow.pngSome potentially good strategies — such as extending product life, offering remanufacturing services, or adding take-back systems — can increase reported emissions in the year they are adopted, because standard accounting captures the added burden from the new processes and logistics they require, but not the avoided replacement of the product. CS3 names this the “carbon investment,” and a refinement module quantifies the offsetting “carbon dividend” — so the long-term benefit of a strategy stays visible even when a single reporting year shows an increase. An effective and peer-reviewed formula was developed and industry-tested.
CS3 is the result of three peer-reviewed publications, each building on the last — from naming the problem, to mapping the approaches, to delivering an operational method. The second was recognised as a top-ten paper at NordDesign 2024.
How little of a company's circular-economy strategy is actually accounted for in its science-based carbon targets.
Read paperThe methodological approaches for accounting for circular economy in support of science-based targets.
Read paperThe operational, GHG-Protocol-aligned method that turns those approaches into numbers companies can report.
Read paper